Posted by: norstarnewengland | July 31, 2016

Picture Post Project – Tracking Change in Foliage Color

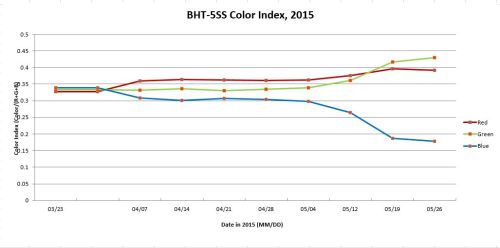
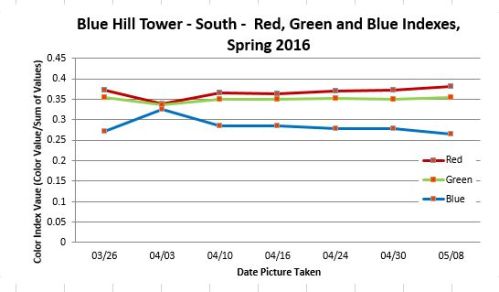
One of the previous blogs had featured the Picture Post Project for Science Friday’s Science Club’s Take a Sample to Answer a Question about the World.  In that blog, were two graphs showing the change in the percentage of red, green, and blue, from the end of March to the end of May, one from 2016 and the other from 2015.  They are included here, again.

GPH_SciFriSampEv_BHT5SS_RGBIndex_Spring2016

GPH_SciFriSampEv_BHT5SS_RGBIndex_Spring2015

The color index is based on the fact that the color on every digital image is a combination of the brightness of each of three color sensors, red, green, and blue, that make up a pixel.  The idea is that though every color is a combination of three colors, more vegetation would result in higher values in the green, and less of the other two.

These graphs were created from the south facing images uploaded to the Picture Post web site for Blue Hill Tower.  First, images from each week were opened in Irfanview (a photo editor application), and the same area was clipped and exported.  Then, in the Picture Post’s application, Analyzing Digital Images, the clipped areas were analyzed to determine the percent of red, green, and blue in each pixel to the sum of red, green and blue values. The result is the value in the y axis, plotted for each image, arranged chronologically in the x axis.

The end of Science Friday’s challenge was May 13, so the graph created was up to the weekend before.  Thus, the results showed no change in the relative positions.  This seemed to be because leaf out progression was not at the point where photosynthesis had really become established.  The following is a graph that continues the analysis to the end of May:

Graphs_IndexesS

This graph is similar to the graph for 2015.  The main difference is when the green value crosses the red.  In this year’s graph, it occurred on 5/21, while the previous year was between 5/12 and 5/19.  Thus, the change is about a week later than the previous year.  While pictures are taken about a week apart, and, thus, due to this ‘temporal resolution,’ the difference is basically ‘within the error of the data,’ the images do show that the method used is viable, and, with more frequent visits, differences may be detected.

The next blogs will introduce the Picture Post project and each of the sites on Great Blue Hill.


Posted by: norstarnewengland | July 30, 2016

My Five Seconds of Fame

In the previous three blogs, I wrote articles detailing how I use sampling in my volunteer activities: as a water sampler for the Charles River Watershed Association, as a water sampler for the Neponset River Watershed Association, and as a digital image taker/poster for the Picture Post Project. I submitted these for the Science Friday Science Club challenge to ‘Sample Everything,’ and hoped to get mentioned.Url_SciFri-To Answer Questions-You Took a Sample

Well, I DID get mentioned! They wrapped up the challenge on May 13, 2016. On the second half of the second hour of the show, they started talking about the challenge. They discussed the kind of responses they received, such as the variety of what they were sampling, the methods they were using, and whether they were doing it as part of a larger study or as individuals. They started talking about Citizen Science Projects, then, within that discussion (at about 12:35 to go):

“…and Craig has been sampling  the Charles River for over 20 years…”

I had hoped that all of them would be mentioned. Or, if one of the water sampling activities were mentioned that the other one would be too. But, I was mentioned!

Posted by: norstarnewengland | May 9, 2016

SciFri Sample Everything – Picture Post

In addition to sampling water for two watershed associations, I also participate in a project called Picture Post, which samples data in several ways.

ExampFixtture

One of the picture post fixtures on Blue HIll

PicturePost is a citizen scientist project where people go to specific locations where a fixture specifically for this project is used to create panoramic image sets of the area.  These images are used primarily to view and track changes in foliage over time.

For this challenge, I used pictures to monitor the foliage on Great Blue Hill just south of Boston from the end of March to early May.  I used pictures in the south direction, which looks over a variety of deciduous trees, including norway maple, ash, hickory, and fruit trees.

How sampling is used – observing all the leaves on every tree in the region every moment in time is just impossible.  Taking pictures periodically reduces the volume of data, but may still be enough to note changes.  This challenge investigation whether weekly monitoring results in changes that can be noted not only during the challenge time period, but also compared to a previous year.

The first results are the pictures used, in chronological order:

See the link for Picture Post to see the full-sized images.

On the second week, April 3, it snowed.  On the other weeks, buds are developing; however, the changes are not easy to detect, visually, from a distance.  But how can these visual changes be reported more objectively?  One way is to take a clip of a portion of each picture where there are trees – another way the data is sampled.  The following is one example:

PBHT20160430S10195SSP001KTCCA2

Clipping an area helps limit the changes to only those related to vegetation – you don’t want to capture changes in the sky, for instance.

Next, a graph is generated that shows the brightness of each red, green and blue color in this clipped area – called a histogram (every pixel has a sensor for red, green, and blue, which, when combined, represent any color in an image).  From the histogram,  the mean value for each color is determined and a graph is created that shows the change in this average over time.  The idea is that in the spring more green will appear in the image.  Thus, the graph should show an increase in the curve.  The following is the graph created.

GPH_SciFriSampEv_BHT5SS_RGBIndex_Spring2016

The results are inconclusive.  The snow storm on April 3 caused the image to be darker around the trees, which resulted in the red, green, and blue values to be less different from one another.  Also, in the last couple weeks, the weather turned colder and the sky was mostly cloudy.  This slowed the foliage progression rate. The following image shows the progress in 2015.  This showed that, around 5/19, the green value finally topped the red value.

GPH_SciFriSampEv_BHT5SS_RGBIndex_Spring2015

Thus, if this challenge were just one or two weeks longer, I would expect that the green values to be greater than the red, signaling that the foliage is out!

Taking picture from Blue Hill Observatory Tower, and me with Boston in the background.

Links:

Blue Hill Observatory (Sponsor of three picture post locations on Blue Hill):  http://www.bluehill.org

Picture Post Project:  http://picturepost.unh.edu

Picture Post Project, Blue Hill Tower:  http://picturepost.unh.edu/analyze/post.jsp?postId=179


Posted by: norstarnewengland | May 8, 2016

SciFri Take a Sample: Water Sampling on the Neponset River


My second citizen science project where sampling is involved is the Neponset River Watershed Association (NepRWA) Citizen Water Monitoring Network (CWMN), which I have been involved for almost 20 years.

NepRWASampWEquip

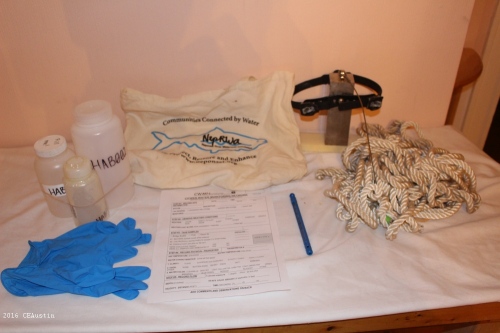
A ‘sampling’ of the equipment I take to a location – bottles, plastic gloves, a sampling aid, a thermometer, a data sheet, and a carrying bag.

The Neponset River is a smaller river compared to the Charles River that runs along the southeastern Boston boundary with Milton and ends in Boston Harbor.  Like the Charles River, the Neponset also has had a history of alteration and abuse.  After a pilot program was successfully run, NepRWA expanded their program, CWMN (pronounced “Swimmin'” – get it?),  around 1998, which is when I became involved.  NepRWA also uses the data to monitor the health of the stream and isolates ‘hotspots’ where action may have to be taken.

I have sampled at several locations over the years. Each site has had their own water quality ‘characteristics.’ At the current location, I am downstream of a pond where two streams come together.  When I sample, I usually have three bottles to fill – a small one for bacteria, a taller one for phosphorus and other indicators, and medium-sized one for pH (acid-base).  Other parameters are measured such as temperature, depth, and flow on a data sheet. During this challenge period, I have gone through my ‘refresher training’ and am ready to go for this year!

How Sampling is Used – It is impossible to constantly monitor all of the water in a river system all of the time.  In these programs, relatively long-term trends are being monitored that don’t require immediate actions such as closing beaches. The amount of water used in the sampling must be large enough to provide meaningful results, but small enough to analyze the samples in a meaningful time.  Thus, both programs sample on a monthly basis at a specified number of locations each month.

NepRWASampWMEAtSite.

A demonstration of me sampling at my designated sampling location

Link:  http://www.neponset.org/projects/water-quality/

Posted by: norstarnewengland | May 7, 2016

SciFri Take a Sample: Water Sampling on the Charles River

This challenge allows me to feature some of my long time citizen science involvements.  For over twenty years, I have been sampling water for two (yes, two) projects.  Unfortunately, despite the fact that the programs have monthly schedules, neither have a sampling date during the challenge period.  However, sampling goes year round for one, so it should count.

How Sampling is Used – It is impossible to constantly monitor all of the water in a river system all of the time.  In these programs, relatively long-term trends are being monitored that don’t require immediate actions such as closing beaches. The amount of water used in the sampling must be large enough to provide meaningful results, but small enough to analyze the samples in a meaningful time.  Thus, both programs sample on a monthly basis at a specified number of locations each month.

The first is the Charles River Watershed (CRWA) Monthly Water Monitoring Program, which I have been involved for over 20 years.  At this point, I have made over 200 samples for this program!

CRWASampWDSheet

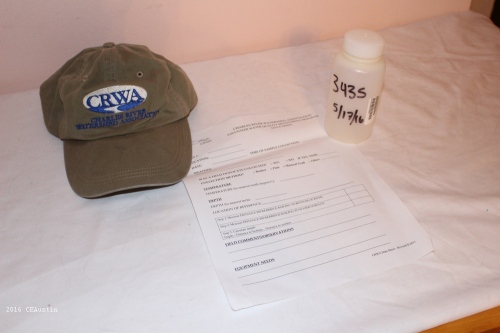
An example  of a sampling bottle and data sheet used.

The Charles River is the well-known river that runs between Boston and Cambridge.  The Charles has had a long history of use and abuse – inspiring a song that has become the unofficial anthem about Boston.  In 1995, CRWA started a sampling program involving a network of volunteers who arrive at an assigned location and take a sample in a bottle and take basic measurements (temperature, depth).  I came on board at the end of that year.  The web page for the program states that this is one of the oldest water sampling programs in the nation.  The program provides CRWA a way to assess the health of the river to set priorities on projects to focus on, and the Environmental Protection Agency (EPA) uses this data to assess the annual report card grade on the water quality.  The sampling program has been a direct factor in improving the overall health of the river to the point where parts are even swimmable again.

I have a partner meet me every month at a quiet location in the suburbs.  The spot is among the cleanest on the river.  Hopefully, April’s results will come out before the end of the challenge.  It’s nice to be part of such a venerable program that has demonstrated how such citizen science programs can actuate real change.

Link:  http://www.crwa.org/field-science/monthly-monitoring


Posted by: norstarnewengland | November 30, 2011

Waymark Milestones: 1500 WM

Waymarks – 11/30/2011

On October 4, 2011, I received my 1500th approved waymark! Since August, no new states were logged. The majority of the postings were in Massachusetts, but some were in Rhode Island.

Here’s the breakdown: Waymarks logged: 1500 Waymarks visited: 581 Waymarks have been placed in all 15 “Divisions” (The last, Animals, in Dec. 07) Different Categories Posted: 496 Number of states/provinces/regions with Waymarks logged/visited: 12 states (U.S.), 3 provinces (Canada).

Officer of six Categories: Massachusetts Historical Markers, Rhode Island Historical Markers, Vermont Historical Markers, Manitoba Historical Markers, Engineering Landmarks and Quarries.

Highlights include:

Electric Fire Alarm System – This was a pleasant surprise while lurking around Old City Hall.

Looff Carousel at Slater Park – The first carousel that went around fast enough to make me significantly dizzy afterwards!

Centennial Commons – I had seen this being constructed.  In fact, I parked in the parking lot that was there!

Springfield, Mass Hit by Tornado – I am mesmerized by the video of the tornado forming over the Connecticut River every time.

Monson Public Library  – A really nice library building…battered by a tornado.

142 Newbury Street – One of the best examples of Frieze Art that I have found.

Bunch of Grapes Tavern Sign – Interesting how there is a connection with Ohio!

U.S.S. Constitution –  The last of its kind, and a rich story. Now I feel that my collection is complete…maybe.

Posted by: norstarnewengland | October 12, 2011

Waymark Milestones 1200 – 1400

In the past year I have passed through milestones 1200, 1300, and 1400 (1500 will be dealt with in a later blog).

1200 WM

1200 was attained some time while in Seattle, Washington, likely the Totem Pole at Pioneer Square .  Places logged included:  MA – Framingham, Cambridge, Attleborough, Norwood, Westwood, Walpole, Norfolk, Natick, Boston, West Bridgewater, Dover, Hingham, and Easton; and WA – Bothell, Munroe, and Seattle.  Some Waymarks include:

Stony Brook Dam at Blake Reservation – I had a  member of the Blake family contact me about this location.

Brook Farm – This was an experimental (utopian?) location for the Transcendalist movement. I’m sure that this location, now within the city limits of Boston, was considered ‘in the country.’

North Easton Historic District – This village has some outstanding buildings, including the Ames Shovel Shop buildings.

Western Heritage Center – This place has all sorts of old equipment and appliances!

Other facts:
Waymarks visited:  444
Different Categories Posted: 403

1300 WM

1300 WM was attained some time while I was at Newport, RI, likely the Newport City Hall .  Places logged include: WA –  Seattle and Kirkland; AK – Anchorage (city), Anchorage (borough), Kenai Borough, Homer, Mat-Su Borough, and Seward; MA – Boston; and RI – Newport.  Some Waymarks include:

Most Westerly Highway Point in North America – Touristy as all heck, but still a pretty cool place to stop.  I even have a certificate!

Resurrection Bay Scenic Boat Tour – This was an all day boat tour that included stopping at the face of a glacier, and several other locations to see animals.

Musk Ox Farm – Where else can you pet a musk ox?  During the tour, I found out that the farm had started in Vermont.  I’ll have to look further to find out where it was.

Seward Highway Terminus – Every highway should end at a gorgeous place like this!

1400 WM

1400 WM was attained in Northampton, MA – at the Gasworks Building .  Places logged include: AK – Anchorage Borough;  RI – Newport; MA – Marlborough, Sudbury, Framingham, Boston,  Attleborough; RI – Pawtucket; and MA – Norwood, Ashland, Milton, Natick,  Springfield, Sharon, Holyoke, South Hadley, Hadley, and Northampton.  Some Waymarks include:

Viking or Newport Tower – Of the list of possible builders, it was likely NOT the Vikings, but no one today is sure.  It is probable that Benedict Arnold (ancestor to the infamously known Benedict Arnold) had it built as a mill, but it doesn’t look like a mill!

Consulate-General of Japan – After the earthquake in Japan, I made a visit to the consulate in the Federal Reserve Building in Boston.

Leavitt-Riedler Pumping Engine – This reservoir pump had been  inaccessible to the public for several years. Now, it is part of a museum – the picture was taken during the open house.

Springfield Armory – Much remains of the buildings, and the museum is well worth the time spent – whether you are a gun fanatic to view the largest small arms collection in the country or love to learn about how small arms were made over time.

Posted by: norstarnewengland | October 11, 2011

Trip to Washington and Alaska

The biggest trip in the last year and some was the trip to the Seattle area of Washington, and the Alaska.

The trip was taken in late August to early September to see friends and relatives. While I have been to Seattle before, Alaska was an entirely new experience.

In Seattle, we had two touring days, and two partial days.  There was one very rainy day with temperatures in the 50s, while the other days were bright and sunny in the 70s. 

In Alaska, we had eight touring days.  The weather varied, almost as much as the terrain that I toured.  But, in every side trip, there seemed to be stretches of good weather that followed foggy or rainy weather.  So, I saw Alaska in several ‘moods’ – sometimes the weather  shines and brings out the beauty in all its brilliance and detail, and sometimes it dulls and obscures the landscape, making it mysterious.

On the rainy day in Seattle, we decided to the Evergreen State Fair, one of the state fairs in Washington State.  I’ve been to several state and county fairs before, including the ‘Big E’, Ohio, and Topsfield.  I especially liked the ecclectic agricultural museum that is open all year.  The next day, we walked downtown Seattle from the WaMu Center to Pikes Market, to Pioneer Square and then the bus station back.

Some of the waymarks posted include the following:

Cinnamon Works Bakery – We were helping one of us choose from the selection of gluten free cookies, wondering which one would be best, when some ahead of us said that she was buying three of the one with just about everything in it for the plane trip home. We didn’t think twice after that, and weren’t disappointed!

Manhole Cover by the Underground Tours – It is a fitting cover for a tour that spends most of the time one level below the present street level – but I love it for the portrait of the group on it – such characters.

Gerhard Johan Ericksen – Speaking of characters, how many towns put their’s on the walls of the downtown buildings?

Western Heritage Center – This is the attic of attics and barn of barns! It’s a place where old appliances and large agricultural equipment ends up.  There’s a lot packed into this place, many of which either you can interact with or can be demonstrated by one of the ‘curators.’

On the first day in Achorage, we acclimated to the new climate.  The time zone change wasn’t much:  one hour from Seattle vs. 3 hrs from Boston to Seattle.  However, daylight hours were really different – while the morning sunrise was about the same, it wasn’t dark until about 10 pm.  But, we were given a tour by car, mostly between the point by the airport and downtown, then we walked through downtown to the Anchorage Museum.  The next few days were spent in the Homer area, a fishing port at one point of the Kenai Peninsula.  After that, we went north to the Palmer area, and finally to Seward via the Alaska Railroad before returning to Anchorage and home through Minneapolis.

Some of the waymarks in Alaska include:

Turnagain Heights Slide at Earthquake Park – The evidence may be getting harder to see in the landscape, but the earthquake of 1964 that struck Prince William Sound was most damaging in Anchorage.  The more I studied this earthquake, the more I was intrigued by the event.

Flattop Mountain – This modest sized mountain is one of the most climbed in Alaska, and its vista is just wonderful.  At the foot of the mountain was the city, and behind were the larger peaks of the Chugach Mountains.   I was at the vista just as twilight was falling and saw the lights of the city coming on.

Most Westerly Point of a North American Highway – I’m sure that they have roads in Barrow, and Nome, but they aren’t numbered highways!  So, this marks the most westard point on the globe that I have been at.   I even have the certificate as ‘proof’ that I was there!

Kachemak Bay State Park – This was about as far from civilization as we got.   The nearest real town was Homer, across the bay.   There was no electricity, and the ranger had left the ranger station the weekend before.  It was great!!  We saw so much, of the flora and fauna, from the cabin we were at as well as the trails we walked and the water taxi to and from Homer.   The cabin had a deck where we could look out into Halibut Cove and see dolphins jumping about and sea otters  lazily floating around.  We even spotted black bears.  My wife spotted one just outside our cabin window!

View of Mt. Illiamna and Mt. Redoubt from Kenai Peninsula – On the way down to Homer, it was thickly cloudy with periods of rain, so we didn’t get any good views.  On the way back from Homer, however, all clouds disintegrated, and we had fine views of them  For the moment, they are sleeping.

 Independence Mine State Park – This historic park is located just within the Talkeetna Mountains.  It is the remains of one of the more successful gold mines in the state.  It also marks the most northern I have been on earth.  It was at the Talkeetnas that I was able to see the subtile beauty of Alaska tundra in the fall.  The fireweed on the slopes turn scarlet, giving the mountains a reddish hue.

Aialik Glacier – While at Seward, we took an all day scenic boat ride around Resurrection Bay.  It was another great trip.  One of the stops along the way was Aialik Glacier, where the boat was parked for twenty minutes while we saw and listened to the glacier as it made its final advance to the ocean.

Seward, Alaska – We stayed at a hotel in Seward.  We spent quite a bit of time at Seward, from eating at restaurants, to staying overnight at the hotel, and visiting the aquarium.  I learned about the man that the city is named after.

Rosenberg Spirit House – There were several opportunities to learn about living in Alaska, including the Russian and Native American cultures there.   The Anchorage Museum in Anchorage had great history and culture exhibits – we could have spent at least another hour there.  In Ninilchik, we saw graves by a church that included fences and laid stones.  In Eklutna, graves were differently decorated.  Most of them either had blankets over the grave or wooden structures  that were spirit houses.  The belief that the soul of a person would live on the earth for another year and needed a place to stay.  The one I waymarked was the most ornate of all.  Most are windowless boxes painted in the family colors.  This one was a miniature house!  But even this change reminds me of how cultures are still changing today due to interactions with other cultures.  Hopefully, the attention to culture preservation today will keep older traditions from becoming lost forever.

Highlights of animals seen:

Washington:
– Black velvet slug
– Banana slug
– Coots

Alaska:
– Beluga whale
– Various salmon
– Brown rabbit
– Moose
– Bald eagle (many!!)
– Magpie
– Stellar jay
– Sea otters
– Porpoises
– Black bear
– Sea anenomea
– Boreal chickadee
– Fox sparrow
– Sandhill cranes
– Pica
– Puffins
– Dahl sheep
– Stellar sea lion

The plane trip home also had spectacular views of great mountains and glaciers.  We had a three hour layover at Minneapolis.  We spent the time riding the people mover, and I had my picture taken by Snoopy.   We landed in Boston, and we had to adjust all over again.
Posted by: norstarnewengland | October 9, 2011

A New Career Direction

Back in August 2010, I was laid off – another ‘statistic’ and ‘victim’ of the “Great Recession.’  The day came with little surprise; I had been ‘underemployed’ for some time. 

So, it was off to find new work, but it wasn’t going to be easy.  Last job really left me with no ‘killer app’ (‘must have’) skills.  In my previous job, I had been an analyst and techical communicator.  I combined elements of both jobs to become a generalist which allowed me to be adaptable in being able to work in a variety of work, but it didn’t make me a ‘go to guy’ for anything specific. In a late recession/early anemic recovery phase, this was deadly.  How can I distinguish myself in a job market where there was about 9% unemployment, with many in the extended period?   To keep it personal, I’m going no further on the specifics.  But, it seems to me that there is a void in the corporate responsibility of investing in its own employees for anticipated needs. 

By January 2010, I realized that the work situation was serious.  So, I decided on a new direction – one that I had been exposed to years before but didn’t pursue further until then.  My new direction?  Geographic Information Systems (GIS).   I enrolled in a graduate program and for the next year and a half, dedicated many nights and weekends.   That ended just last September, so I now have a Masters degree.   I also have been interning and have been learning a lot and enjoying it.  It’s fine for now, but I’ll be spending time figuring out the long term.

I have Waymarking/Geocaching to  thank for keeping that idea alive, as I use GPS to find neat objects and places and log them.    I always knew that I have been geographically minded and have loved maps.  Now, I can do it every day!

Posted by: norstarnewengland | October 6, 2011

One Year Ago – One Year Later

It’s been about six months since my last post, of an event that happened over a year go. What has been happening? Lots! But, to get to the present day, I’ll have to be briefer, and put several stories together.

A little over a year ago, I was out of a job and made a trip to Alaska. Today, I’m in a new career, starting over – for about the third time. Between these times, there have been significant weather events and personal events. I’m still trying to find my place and hope that you stop by some time to check my progress!

Older Posts »

Categories